How Spectator Presence Alters Point Spread Calculations in College Basketball
Written by Jakob Lorenz · Aug 25, 2026
How Spectator Presence Alters Point Spread Calculations in College Basketball
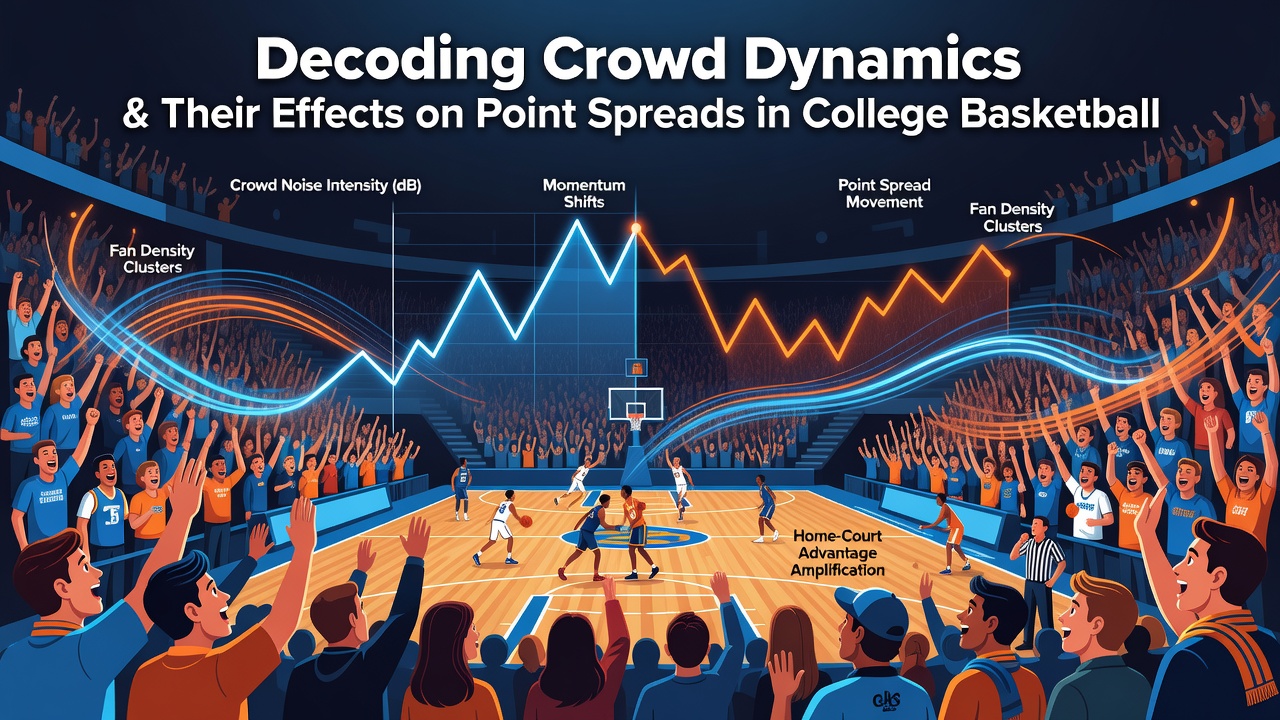
College basketball venues generate distinct acoustic and visual environments that influence player execution and subsequently shape how oddsmakers construct point spreads, with data from multiple seasons indicating measurable differences in home team performance under varying crowd conditions.
Researchers tracking NCAA Division I contests have documented that arenas exceeding 10,000 seats with high occupancy rates correlate with reduced visitor shooting percentages, particularly from three-point range, while home teams maintain or improve their offensive efficiency metrics. These patterns emerge consistently across power conferences and mid-major leagues alike, prompting betting markets to adjust spreads by an average of 1.5 to 3 points in favor of the home side when historical attendance and noise data support elevated home-court effects.
Venue Acoustics and Performance Metrics
Sound pressure levels recorded during conference play often surpass 100 decibels in student-heavy sections, creating communication barriers that disrupt defensive rotations and inbound plays for visiting squads. Studies conducted by sports analytics groups show turnover rates climbing 8 to 12 percent for road teams in the loudest facilities, a shift that directly feeds into pre-game spread modeling. Oddsmakers incorporate these venue-specific tendencies alongside travel distance, rest days, and injury reports when finalizing numbers released to the public.
Conferences such as the Big Ten and SEC feature several arenas where sustained crowd volume has produced statistically significant deviations from baseline performance, while smaller gymnasiums in the Mountain West or Atlantic 10 demonstrate comparable effects when student sections reach full capacity early in games.
Data Patterns Across Recent Seasons
Analysis of point-spread outcomes reveals that home teams in high-attendance environments cover the spread at rates approximately 4 to 7 percentage points above their season-long averages. These figures appear in reports compiled by organizations monitoring collegiate athletics, including data aggregated through NCAA-affiliated research initiatives that examine game logs and environmental variables. The adjustments become more pronounced during rivalry matchups or when visiting teams arrive from distant time zones, amplifying the combined impact of crowd energy and fatigue.
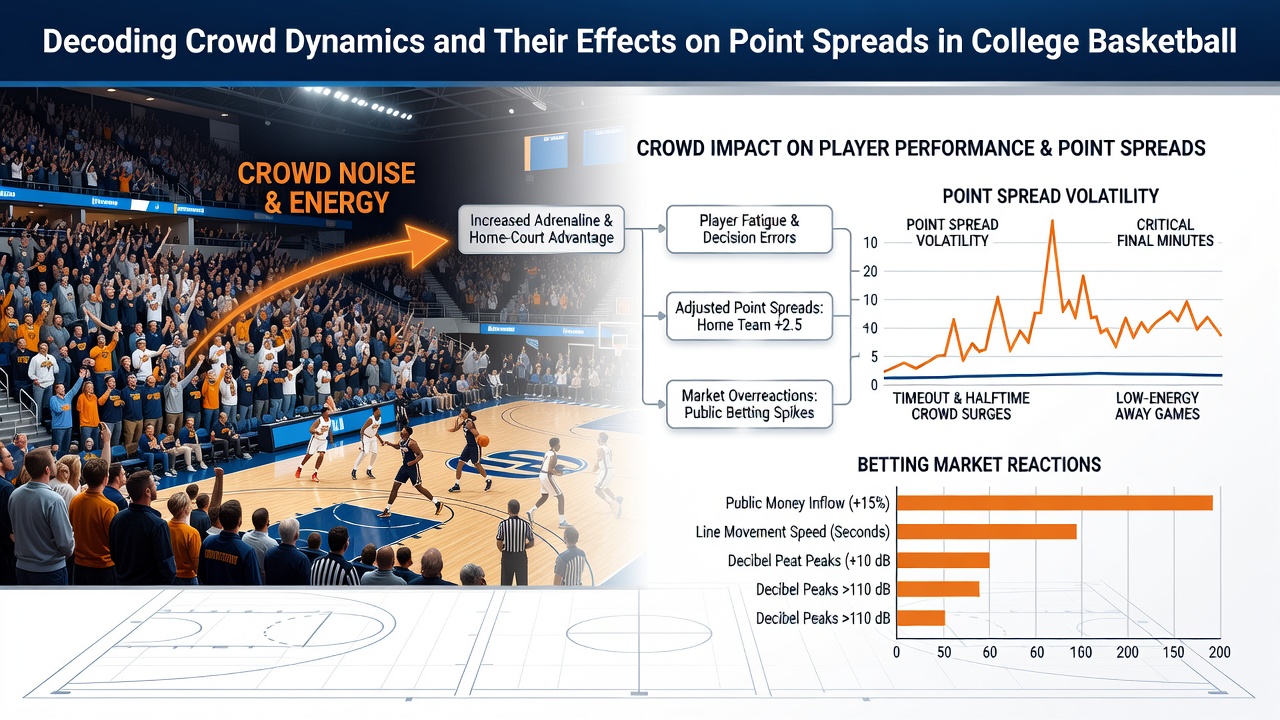
Betting operators and independent analysts track these variables through advanced modeling that weights crowd density against historical shooting and turnover splits. One notable dataset released by a university-affiliated sports performance lab in 2025 highlighted how mid-week games in raucous environments produced larger spread movements compared to weekend contests with similar team profiles.
Oddsmaker Adjustments and Market Response
Point spreads published by major sportsbooks reflect aggregated information from multiple inputs, among them crowd-related performance indicators collected over prior seasons. When new facilities open or renovations increase seating capacity, line makers recalibrate baselines accordingly, often resulting in wider home advantages for programs with established fan bases. Public bettors and professional syndicates monitor these shifts, with sharp money frequently targeting inflated lines that overlook recent attendance trends or student-section growth.
Geographic factors interact with crowd dynamics as well. Programs located in regions with harsh winter weather sometimes experience amplified home effects because visiting teams face additional logistical challenges, though quantitative models isolate crowd influence from these secondary variables through regression analysis.
Conference Variations and Emerging Trends
Differences across leagues remain evident in long-term data sets. The ACC and Big 12 post some of the strongest home-team spread coverage rates in high-decibel venues, whereas certain West Coast conferences show more modest effects tied to smaller average arena sizes. Observers note that transfer portal activity and roster turnover can temporarily mute these patterns until new players acclimate to specific home environments.
August 2026 recruiting cycles and facility announcements continue to influence future modeling, as programs invest in upgraded sound systems and seating expansions that may further intensify home advantages. Regulatory bodies in various states, including those overseeing collegiate athletics compliance, maintain records that analysts cross-reference when evaluating long-term betting market efficiency.
Conclusion
Crowd dynamics represent one measurable component within broader frameworks used to evaluate college basketball point spreads. Quantitative tracking of attendance, noise levels, and resulting statistical shifts provides oddsmakers and bettors with additional context for line construction and game analysis. Continued collection of venue-specific data supports refined projections as facilities and fan behaviors evolve across NCAA competition.