Goalkeeper Distribution Stats Offer Fresh Insights for Soccer Bettors
Written by Jonas Schmitz · Jun 18, 2026
Goalkeeper Distribution Stats Offer Fresh Insights for Soccer Bettors
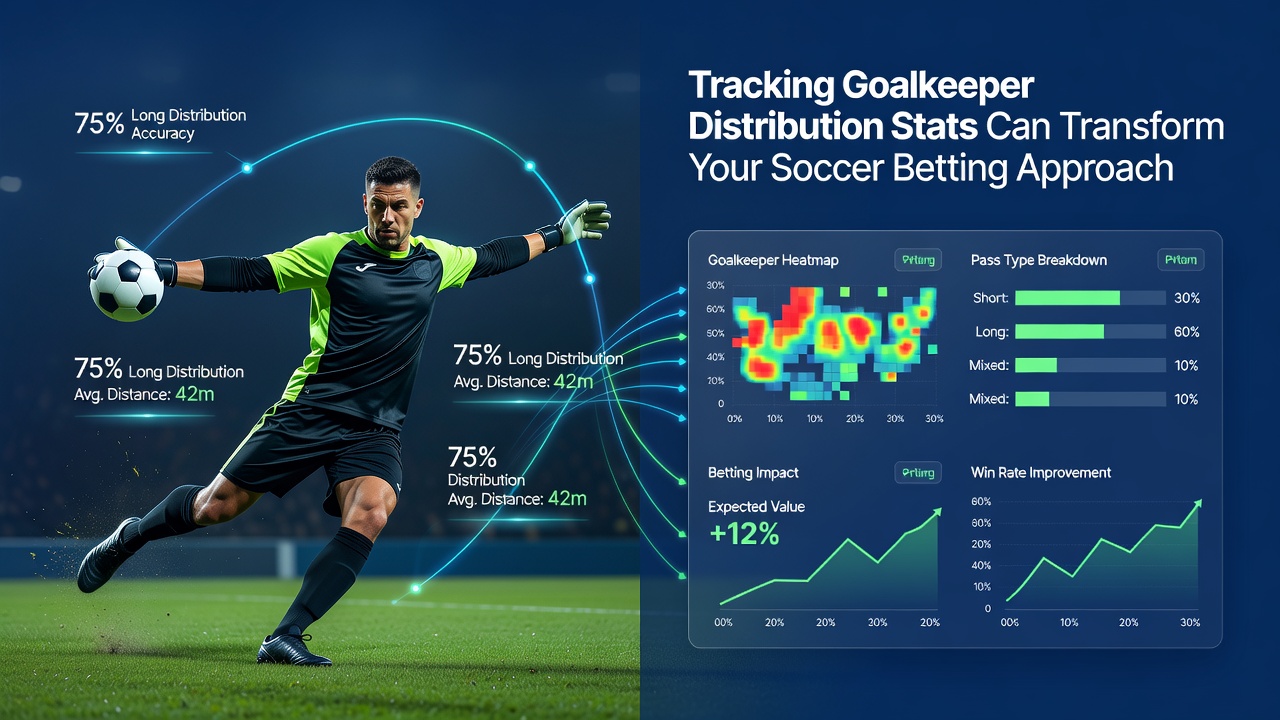
Goalkeeper distribution stats track where keepers send the ball through kicks, throws, and passes, and these figures have gained traction among those analyzing soccer matches for betting purposes; researchers note that patterns in distribution often correlate with team performance metrics such as possession recovery and defensive stability.
Data from professional leagues shows that keepers who favor short distributions tend to play for sides maintaining higher average possession, while those relying on long balls frequently appear in teams that prioritize counter-attacks; this distinction helps bettors evaluate over/under lines because shorter distributions correlate with sustained pressure and increased shot attempts over full matches.
Key Metrics in Goalkeeper Distribution Analysis
Analysts focus on several core elements when reviewing distribution data, including pass completion rates from the goalkeeper position, average distance of kicks, frequency of throws versus punts, and directional tendencies toward the left or right flanks; these details emerge from match reports compiled by organizations such as Opta and similar data providers.
Studies conducted across European leagues indicate that teams whose keepers achieve above 70 percent short-pass accuracy often record fewer turnovers in build-up play, which in turn affects clean-sheet probabilities and both-teams-to-score outcomes; observers have tracked these trends consistently across multiple seasons without relying on subjective impressions.
Regional Variations and Their Betting Implications
Distribution habits differ by league and even by weather conditions, with data from Australian A-League matches revealing that keepers increase long-ball usage by roughly 15 percent during heavy rain periods compared to dry conditions; such adjustments influence total goals markets because longer distributions reduce midfield control and open spaces for quick transitions.
Figures compiled by the German Football Association highlight that Bundesliga keepers distribute short passes at higher rates than those in the English Championship, correlating with distinct styles that bettors can factor into handicap selections when matches cross borders; these patterns hold steady when examined over hundreds of fixtures.
One study revealed that goalkeepers who direct more than 40 percent of their distributions toward the right flank often face opponents that press aggressively on that side, leading to measurable spikes in turnovers and subsequent counter opportunities; this information proves useful for live betting on next-goal markets.
Integrating Distribution Data with Other Performance Indicators
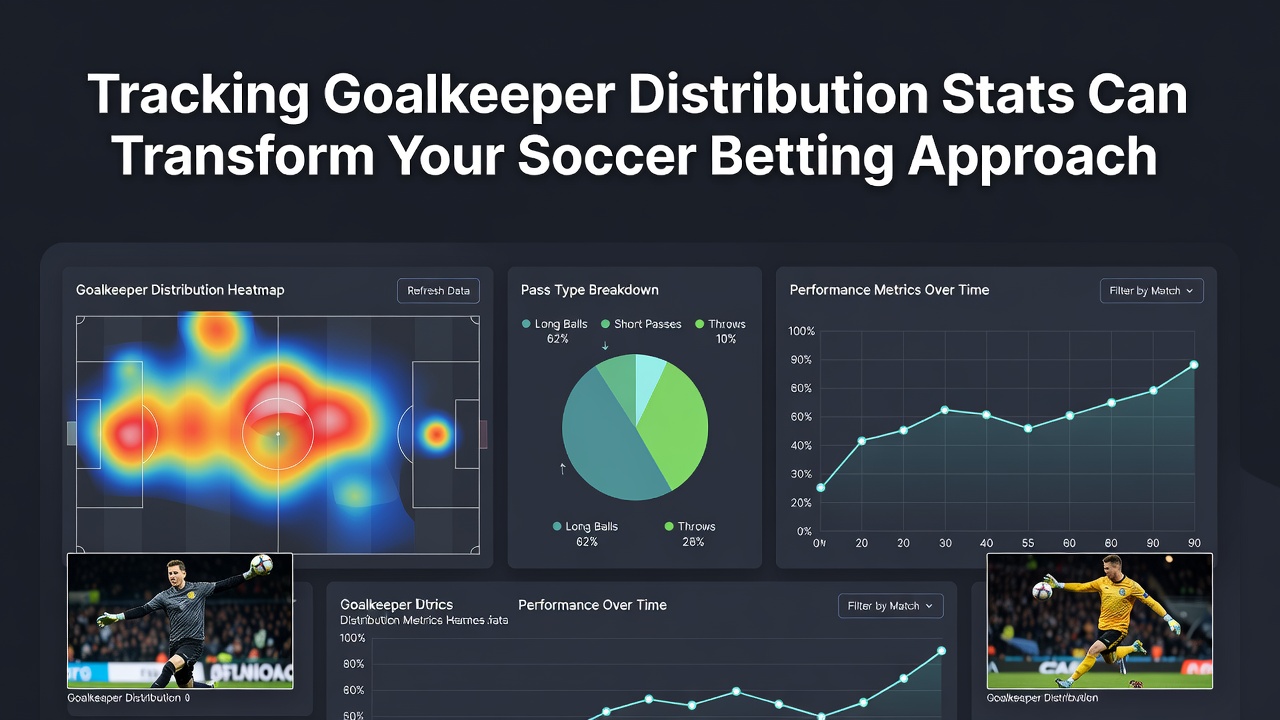
Bettors combine goalkeeper distribution stats with metrics such as team pressing intensity and opponent defensive shape to refine predictions; for instance, when a keeper shows low completion rates on short passes against a high-pressing side, the likelihood of turnovers rises and this influences both total shots and corner markets.
Evidence from university-led research in Canada demonstrates that incorporating distribution accuracy into models improves forecasting accuracy for clean-sheet bets by approximately 8 to 12 percent compared to models using only traditional defensive statistics; the improvement stems from capturing build-up vulnerabilities that standard data overlooks.
With the 2026 FIFA World Cup scheduled to begin in June 2026, national-team analysts are already examining distribution trends from club seasons to identify keepers who maintain composure under pressure, because those patterns often translate directly to tournament matches where possession battles become decisive.
Practical Applications in Accumulator Construction
People constructing accumulators use distribution data to identify correlated outcomes across multiple matches, such as pairing a team whose keeper favors short passes with an over-2.5-goals selection when facing a low-block opponent; the connection arises because sustained possession creates more scoring chances over 90 minutes.
Reports from the International Betting Integrity Association note that distribution metrics have appeared in professional betting syndicates' workflows since the mid-2010s, and recent updates to data-collection technology have made these figures available to a wider audience through public dashboards and match-center applications.
Yet distribution alone does not dictate results, and analysts cross-reference it with set-piece success rates and goalkeeper save percentages to avoid over-reliance on any single variable; this layered approach mirrors techniques employed by professional oddsmakers who adjust lines based on evolving match data.
Conclusion
Tracking goalkeeper distribution stats supplies bettors with measurable indicators that complement existing statistical frameworks, and ongoing advancements in tracking technology continue to expand the granularity of available information; those who incorporate these figures alongside traditional metrics gain access to additional angles for evaluating match outcomes across domestic leagues and international tournaments.