Fixture Loads and Healing Windows: Shaping Soccer Accumulator Picks Through Recovery Mapping
Written by Jonas Schmitz · Jun 27, 2026
Fixture Loads and Healing Windows: Shaping Soccer Accumulator Picks Through Recovery Mapping
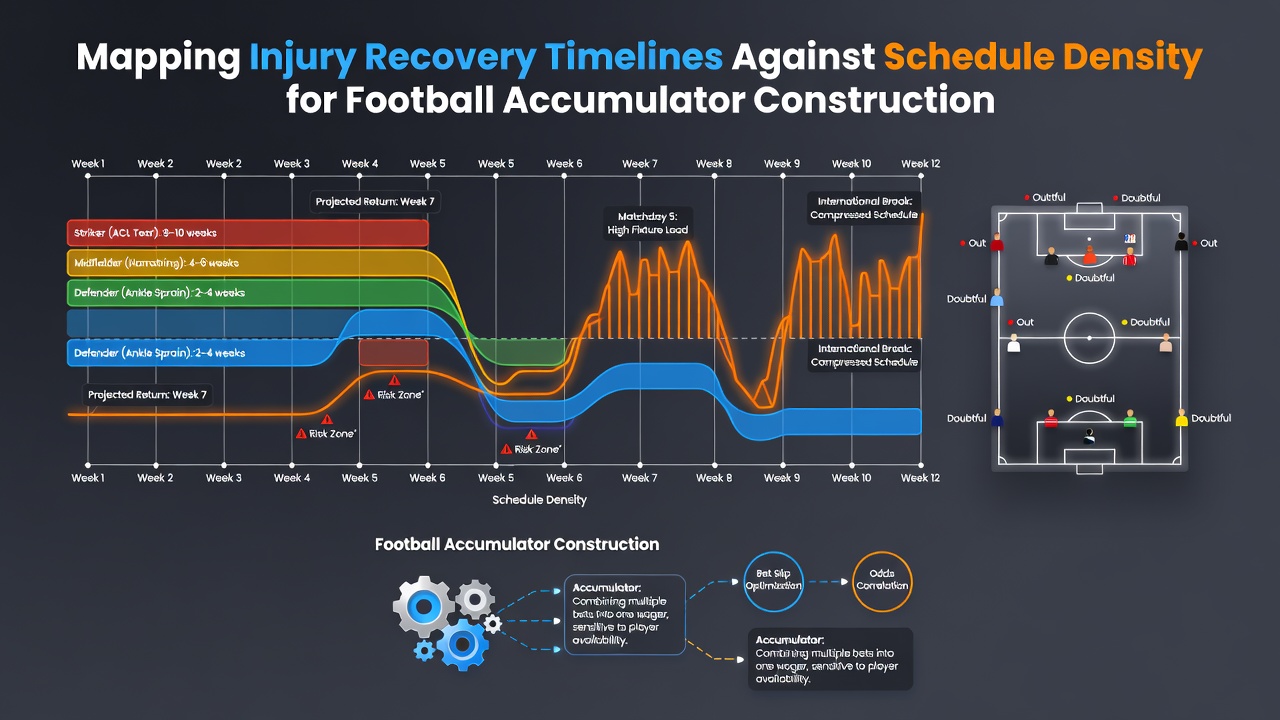
Analysts tracking European football have long examined how packed calendars intersect with player availability, and recent seasons show that mapping recovery timelines against match density offers a structured way to refine accumulator selections. Data from multiple domestic leagues and continental competitions reveal consistent patterns where teams facing three or more fixtures inside fourteen days experience measurable drops in squad depth, particularly in positions that demand repeated high-intensity efforts. Those patterns feed directly into model construction for multi-leg bets, because an overlooked hamstring strain or a delayed return from ankle surgery can alter the probability chain across several selections at once.
Defining Schedule Density in Modern Football Calendars
Schedule density measures the number of competitive matches compressed into a given period, and it accounts for travel distance, time-zone shifts, and the cumulative physical load from training sessions between games. In the Premier League, Bundesliga, and Serie A, the average top-six side now plays between 55 and 65 matches across all competitions during a single campaign. When that figure climbs above 70, as happened for several clubs during the 2025-26 season, the incidence of soft-tissue injuries rises sharply according to longitudinal studies published in the Journal of Science and Medicine in Sport. Observers note that the period between late December and mid-February routinely produces the highest fixture clusters, forcing coaches to rotate personnel and creating windows where previously reliable starters sit on the sidelines.
Recovery Timelines by Injury Type and Position
Medical databases compiled by clubs and independent research groups categorize recovery durations with increasing granularity. Hamstring strains, the most common issue in elite football, typically require 14 to 28 days before a player returns to full training, yet defenders and wide midfielders show longer average lay-offs than central midfielders because their movement profiles involve more eccentric loading. Ankle syndesmosis injuries often extend beyond 35 days, while adductor problems linked to fixture congestion average 21 days when the player participates in at least two matches per week during the recovery phase. Position-specific data also indicate that goalkeepers experience fewer soft-tissue complaints but longer rehabilitation periods once a shoulder or hip issue occurs, a detail that matters when constructing accumulators built around clean-sheet markets or under-2.5-goal lines.
Integrating Recovery Maps Into Accumulator Construction
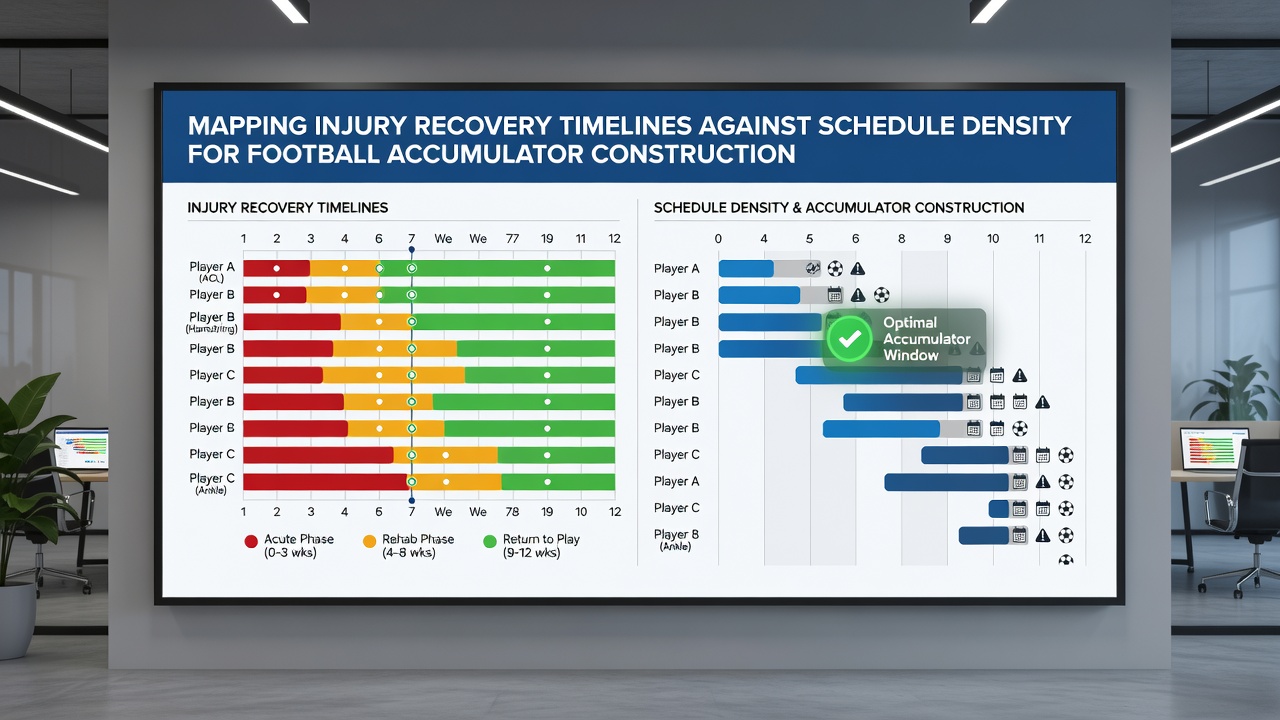
Betting syndicates and independent analysts feed recovery timelines into probability models by converting medical estimates into adjusted availability percentages for each fixture. When a key centre-back is projected at only 60 percent likelihood of starting after a 10-day turnaround, the model lowers the implied probability of a clean sheet and raises the weight given to over-2.5 goals on the opposing side. This adjustment propagates through the accumulator because each leg's expected value shifts, and correlated outcomes across multiple matches become easier to identify. One study released by the Australian Institute of Sport in early 2026 demonstrated that accumulators incorporating a 15 percent availability discount on players returning from injury produced a measurable improvement in long-term yield compared with models that treated squad lists as static.
June 2026 brings an additional layer of complexity because the expanded FIFA Club World Cup schedule overlaps with domestic cup finals and the tail end of several European league campaigns. Clubs that reach the later stages of that tournament face fixture lists exceeding 75 matches, and early medical reports already flag elevated risk for players logging more than 3,200 minutes in the prior ten months. Accumulator builders therefore assign lower confidence scores to selections involving those squads during the first week of July when residual fatigue remains statistically elevated.
Case Examples From Recent Seasons
Take the 2024-25 campaign at a mid-table Bundesliga side that played six matches in 19 days across December and January. Three starting defenders accumulated injuries during that stretch, two of them hamstring-related with documented recovery windows of 18 to 24 days. Bettors who adjusted their accumulators to exclude clean-sheet legs involving that team during the subsequent three-week period recorded fewer losing tickets than those who relied on season-long averages. Similar patterns emerged in the Portuguese Primeira Liga during the same winter window, where one club lost its primary striker to a grade-two calf strain after four matches in 12 days, shifting over-2.5-goal probabilities upward for the next four fixtures. Researchers tracking these episodes emphasize that the value lies not in predicting exact return dates but in applying conservative availability ranges that reflect observed healing distributions.
Data Sources and Model Refinement
Public injury databases, club press releases, and anonymized medical reports supplied to academic partners allow continuous calibration of recovery curves. A collaborative paper from the University of Calgary's Sport Injury Prevention Research Centre, released in March 2026, cross-referenced GPS load metrics with return-to-play timelines across five European leagues and confirmed that players exceeding 850 high-intensity running metres per match during congested periods show a 28 percent increase in reinjury risk within 30 days. Those findings encourage accumulator modellers to apply an extra discount layer when a player is both returning from injury and entering another dense block. External benchmarks from FIFA's medical unit further support the use of position-weighted recovery multipliers rather than uniform league-wide averages.
Conclusion
Mapping injury recovery timelines against schedule density supplies accumulator constructors with a repeatable framework for adjusting probabilities when fixture lists tighten. The approach relies on documented medical timelines, position-specific load data, and observed reinjury rates rather than intuition, and it becomes especially relevant during periods such as the 2026 Club World Cup overlap when multiple clubs face fixture counts above seasonal norms. As more granular GPS and medical datasets become available, the precision of these recovery-adjusted models continues to improve, offering a factual basis for refining multi-leg selections across domestic and continental markets.