Examining Travel Fatigue Influences on NBA Point Spread Results in Condensed Schedules
Written by Ben Schmitt · Jun 9, 2026
Examining Travel Fatigue Influences on NBA Point Spread Results in Condensed Schedules
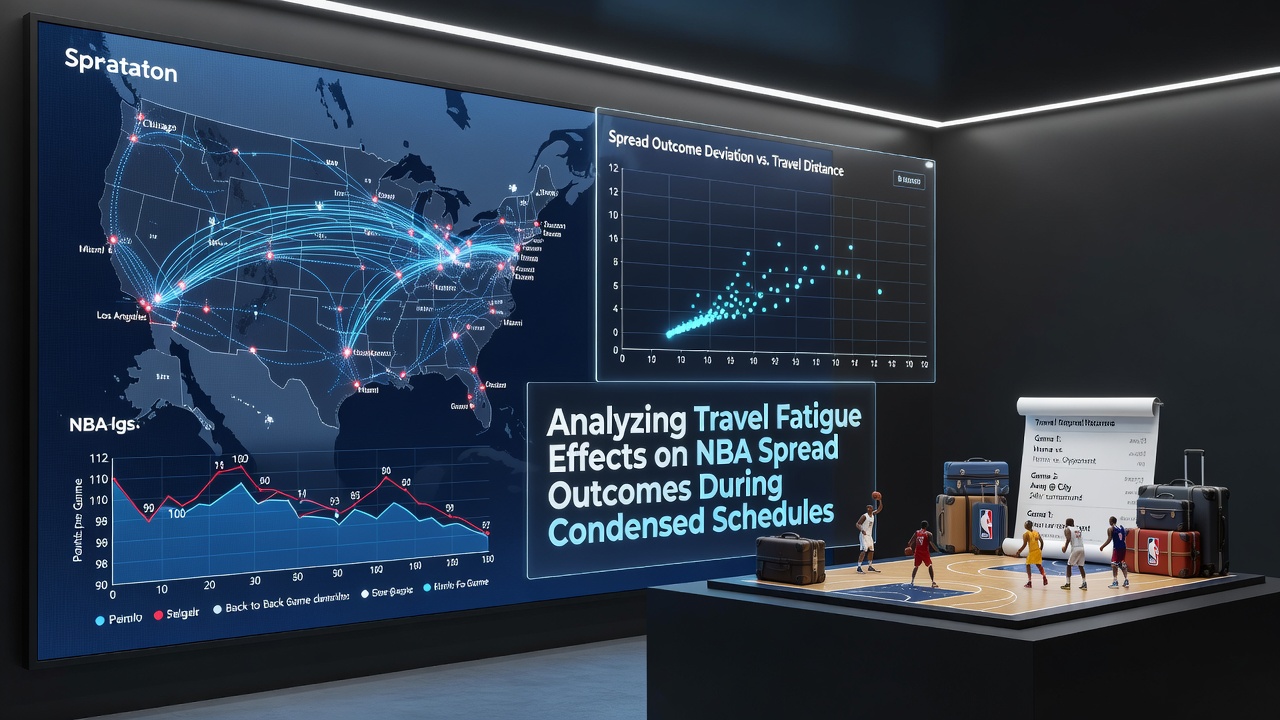
Travel demands place measurable stress on NBA rosters when teams face multiple games in short windows and data from recent seasons shows patterns in how these factors shift point spread outcomes. Teams covering fewer miles between contests tend to perform closer to closing lines while those logging extensive air and bus time often land on the wrong side of spreads especially in road environments. Observers note that the league schedule makers pack games tightly from November through March creating sequences where recovery windows shrink and cumulative fatigue builds across rotations.
Defining Travel Fatigue in Professional Basketball Contexts
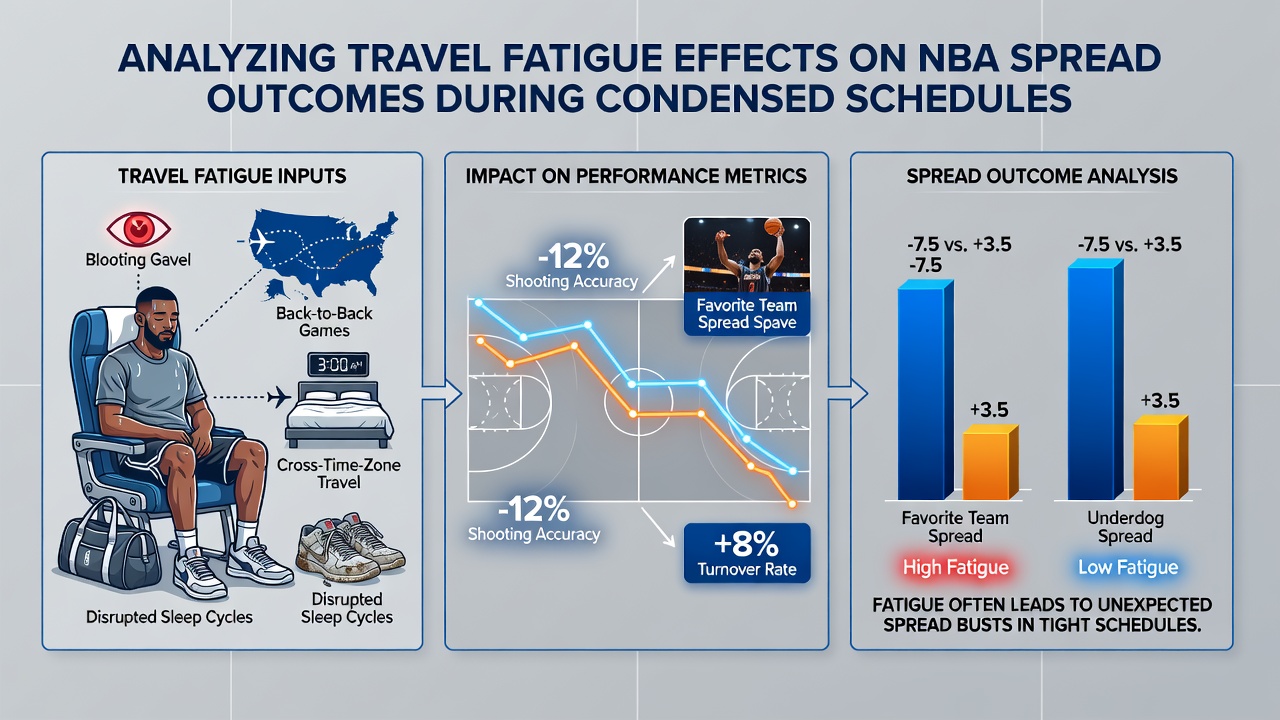
Travel fatigue encompasses sleep disruption jet lag and physical strain from flights plus ground transportation rather than simple distance alone. Studies conducted by sports science groups track heart rate variability and reaction times among players crossing multiple time zones and results indicate measurable declines in shooting efficiency and defensive rotations after overnight trips. The NBA plays 82 regular season games plus potential playoff contests which means condensed periods force teams into back to back contests or three games in four nights on a regular basis. Data compiled by league statisticians reveals that road teams traveling over 2000 miles in a seven day stretch cover spreads at lower rates compared with those staying within regional clusters.
Condensed Schedule Patterns and Their Frequency
League calendars place particular emphasis on holiday periods and late season pushes where multiple teams encounter five games in seven days or similar clusters. In the 2025-2026 season such stretches affected over 40 percent of teams during January and February according to official scheduling records. Researchers at Canadian universities specializing in exercise physiology have examined these periods and found that recovery protocols including sleep monitoring and nutrition adjustments mitigate some effects yet performance gaps persist in statistical categories tied directly to spread margins such as points allowed in the final five minutes. What's interesting involves how back to back road games amplify variance with visiting squads posting lower cover rates when the second contest occurs after crossing two or more time zones.
Data Trends Linking Fatigue to Spread Movements
Statistical analysis of spread outcomes from 2018 through 2025 shows road teams in condensed schedules covering at approximately 46 percent when travel exceeds 1500 miles compared with 51 percent in lighter travel weeks. These figures come from aggregated play by play data released by the league and betting market archives. Teams playing the second half of a back to back after long flights exhibit reduced three point accuracy and increased turnover rates which directly influences margin outcomes. One study released by an Australian sports institute tracked collegiate and professional athletes across similar schedules and noted consistent drops in sprint speed and lateral quickness after cumulative travel loads. Observers tracking NBA results note that spreads adjust modestly once markets incorporate fatigue signals yet residual edges appear in specific subsets such as Pacific division teams visiting Eastern Conference venues during winter months.
Additional layers emerge when examining rest advantage differentials where one team arrives with two days off while the opponent lands the morning of the contest. Such mismatches produce cover rates favoring the rested side at levels exceeding 54 percent over multi year samples. The reality is that schedule density varies by conference with Western Conference clubs logging higher average mileage due to geographic spread. European basketball federations have adopted stricter rest rules in their domestic leagues and comparative data suggests fewer extreme fatigue related performance dips although direct NBA translation remains limited.
Regional and Seasonal Variations in Outcomes
Performance data breaks down differently across months with early season travel producing milder effects than late season stretches when rosters already carry accumulated wear. Teams based in central time zones encounter fewer zone shifts during cross country swings which correlates with steadier spread results in available datasets. Government health agencies in the United States including those monitoring athlete wellness have published general guidelines on sleep hygiene that teams adapt during condensed periods though compliance rates differ. June 2026 marks the start of schedule release preparations for the following campaign and early indications point toward continued emphasis on regional groupings aimed at trimming total travel miles. Such adjustments could alter baseline fatigue profiles yet current models still rely on historical travel logs to project spread probabilities.
Practical Applications for Outcome Analysis
Analysts incorporate travel metrics into predictive frameworks by weighting mileage totals alongside rest days and prior game location. These models assign incremental adjustments to expected margins which then influence projected spread probabilities. Industry reports from North American sports analytics firms highlight that incorporating time zone changes improves accuracy in back to back scenarios while ignoring them leaves residual error in margin forecasts. People reviewing historical lines observe that public betting tends to overlook these variables in favor of recent form leaving room for data driven differentiation during heavy travel weeks. The ball remains in the court of teams implementing targeted recovery strategies as league density stays elevated through the regular season.
Conclusion
Travel fatigue interacts with condensed NBA schedules in ways that produce identifiable shifts in spread outcomes according to aggregated performance records and physiological studies. Regional schedule design time zone effects and recovery protocols all contribute to measurable patterns that persist across multiple seasons. Continued monitoring of these variables alongside evolving league calendars provides ongoing insight into how such factors influence results in future campaigns.