Decoding Foul Trouble Trends in Basketball to Optimize Live Betting Windows
Written by Jonas Schmitz · May 28, 2026

Decoding Foul Trouble Trends in Basketball to Optimize Live Betting Windows
Foul trouble patterns in professional basketball reveal consistent rhythms that shape game flow, and analysts track these sequences through detailed play-by-play records to identify when players risk disqualification. Teams in the NBA and international leagues accumulate fouls at different rates depending on defensive schemes, pace of play, and matchup dynamics, which creates measurable windows for in-game adjustments. Data compiled across multiple seasons shows that centers and power forwards draw personal fouls at higher frequencies early in games because they contest shots near the rim, whereas perimeter players often see their foul counts rise during transition sequences later in quarters.
Tracking Accumulation Patterns Across Positions and Quarters
League-wide statistics indicate that foul rates spike in the second and fourth quarters as fatigue sets in and referees tighten enforcement on physical contact. Researchers examining NBA data from the past five seasons have noted that players who reach three fouls by halftime face elevated disqualification risk in the final period, particularly when their teams trail and increase defensive pressure. This positional variation matters because betting markets adjust live odds on player props and team totals once foul trouble becomes evident, allowing observers to monitor substitution patterns that signal coaches protecting key contributors.
What's interesting emerges when comparing regular-season trends to playoff environments, where officiating crews call fewer touch fouls and teams adapt by switching more frequently on defense. In May 2026, early postseason matchups already demonstrated these shifts as several high-minute forwards avoided early foul trouble through improved positioning, which altered live betting lines on over/under totals for points scored in the paint. External factors such as travel schedules and back-to-back games further influence foul rates, with road teams showing slightly higher foul counts in the opening quarter according to aggregated tracking data.
Integrating Advanced Metrics for Real-Time Decisions
Modern analytics platforms combine hustle stats, defensive rating, and foul-draw percentages to forecast trouble thresholds before they appear on the scoreboard. One study from a Canadian sports science institute linked higher foul rates to teams employing drop coverage schemes against pick-and-roll actions, creating opportunities to evaluate live wagers on opposing teams exceeding their season average for free-throw attempts. Observers note that monitoring foul trouble also extends to bench players who enter games with limited minutes yet absorb quick calls while adjusting to the pace.
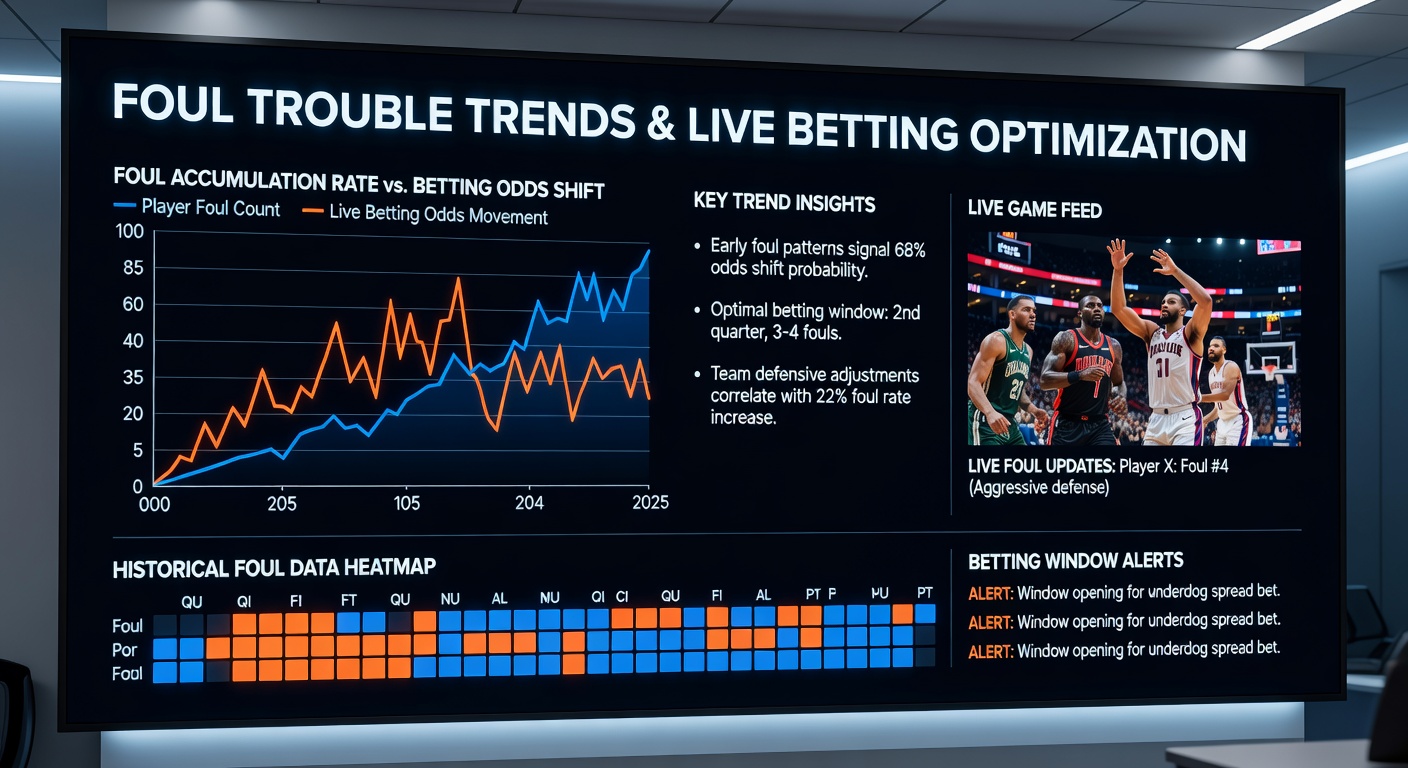
Betting windows narrow when a star player picks up their fourth foul with more than eight minutes remaining, because substitution patterns become predictable and offensive efficiency often declines. Figures from recent campaigns reveal that teams playing without their primary rim protector allow opponents to convert higher percentages at the basket, which directly impacts live over/under markets on points in the paint. Those who've studied these sequences know that combining foul data with usage rates and defensive rebounding percentages produces clearer signals than isolated foul counts alone.
Regional Variations and International Comparisons
European leagues display different foul distributions compared with North American play because rules on flagrant contact and defensive three seconds create distinct enforcement environments. A report from an Australian research consortium on global basketball trends highlighted how EuroLeague teams commit fewer shooting fouls on three-point attempts yet see elevated bench foul totals during end-of-quarter situations. These cross-league differences allow bettors to adjust expectations when following NBA players transitioning to international competitions or vice versa, especially when live windows open during international tournaments scheduled for summer 2026.
Coaching adjustments appear most clearly in timeout data, where staffs deliberately rest players sitting on three fouls even if the game remains close. Evidence from tracking systems shows that such decisions reduce disqualification rates by nearly 30 percent in the second half, which in turn stabilizes live betting lines on spreads once the protected player returns. adn because foul trouble cascades across multiple positions, markets on team total fouls often move faster than individual player props during stretches of physical play.
Conclusion
Comprehensive review of foul trouble trends demonstrates how positional data, quarter-specific rates, and substitution timing combine to create identifiable live betting opportunities across professional basketball. Analysts who integrate these elements with pace metrics and defensive scheme information gain structured insights into when odds shift most dramatically. As tracking technology continues to refine foul attribution and predictive models, the precision of these windows expands for observers monitoring games in real time.