Data-Driven Edges in NBA Over/Under Bets: Pace, Injuries, and Hidden Trends
Written by Ben Schmitt · Mar 22, 2026
Data-Driven Edges in NBA Over/Under Bets: Pace, Injuries, and Hidden Trends
Over/under bets in the NBA hinge on total points scored by both teams, and data reveals consistent edges for those who dig into pace, injuries, and lesser-known trends, especially as the league pushes into high-stakes stretches like March 2026 when playoff races intensify and rotations tighten.
Pace: The Engine Driving Totals
Pace measures possessions per game, a metric that directly correlates with scoring volume since faster tempos mean more shots and opportunities, according to data tracked on Basketball-Reference, where top teams like the 2025-26 Boston Celtics averaged 102.3 possessions while slower squads such as the Memphis Grizzlies clocked in at 98.1.
Researchers analyzing five seasons of NBA data found teams playing above league-average pace push over/under lines higher by an average 4.2 points, a shift that sharp bettors exploit by cross-referencing pace-adjusted totals; take one case from early 2026 where the Indiana Pacers, ramping up to 101.8 possessions amid a guard-heavy lineup, consistently cleared 225.5 lines against similarly brisk opponents like the Atlanta Hawks.
But here's the thing: defensive pace matters too, as opponents forcing turnovers or slowing transitions drop effective possessions, something observers note in matchups where elite defenders like the New York Knicks hold foes under 99 possessions, trimming projected totals by 3-5 points even on neutral lines.
And while basic pace stats grab headlines, adjusted metrics like offensive rating per 100 possessions reveal deeper edges, with teams exceeding 115 ratings in fast-paced games hitting overs 62% of the time per recent league-wide figures.
Spotting Pace Shifts in Real Time
Coaches tweak pace mid-season for playoff prep, a pattern evident in March 2026 as contenders like the Denver Nuggets accelerated from 99.2 to 101.4 possessions over 10 games, boosting overs from 48% to 70% in that span; data indicates such surges often precede line movements, yet books lag by 1-2 contests before adjusting fully.
Injuries: The Great Equalizer in Scoring Projections
Injuries disrupt scoring formulas more than most realize, particularly when star players exit lineups and force pace alterations or substitution-heavy minutes, with league data showing games sans top-10 usage players drop totals by 5.8 points on average.
Experts tracking injury reports via advanced platforms have observed that guard injuries hit hardest, slowing pace by 2.3 possessions while slashing three-point volume 15%, as seen in the 2025-26 Milwaukee Bucks' stretch without Damian Lillard where overs cashed just 35% versus their season 55% norm.
What's interesting surfaces in load management trends, where teams rest stars on back-to-backs, compressing rotations and inflating bench scoring variance; figures from the American Gaming Association highlight how such scenarios create 7% edges in under bets during March 2026's grueling schedule, as fatigued benches struggle against fresher defenses.
Yet partial injuries like ankle tweaks linger overlooked, prompting pace dips without full lineup changes, and those who've parsed player-tracking data discover secondary effects such as increased mid-range attempts, which cap totals below Vegas projections by 2-4 points consistently.
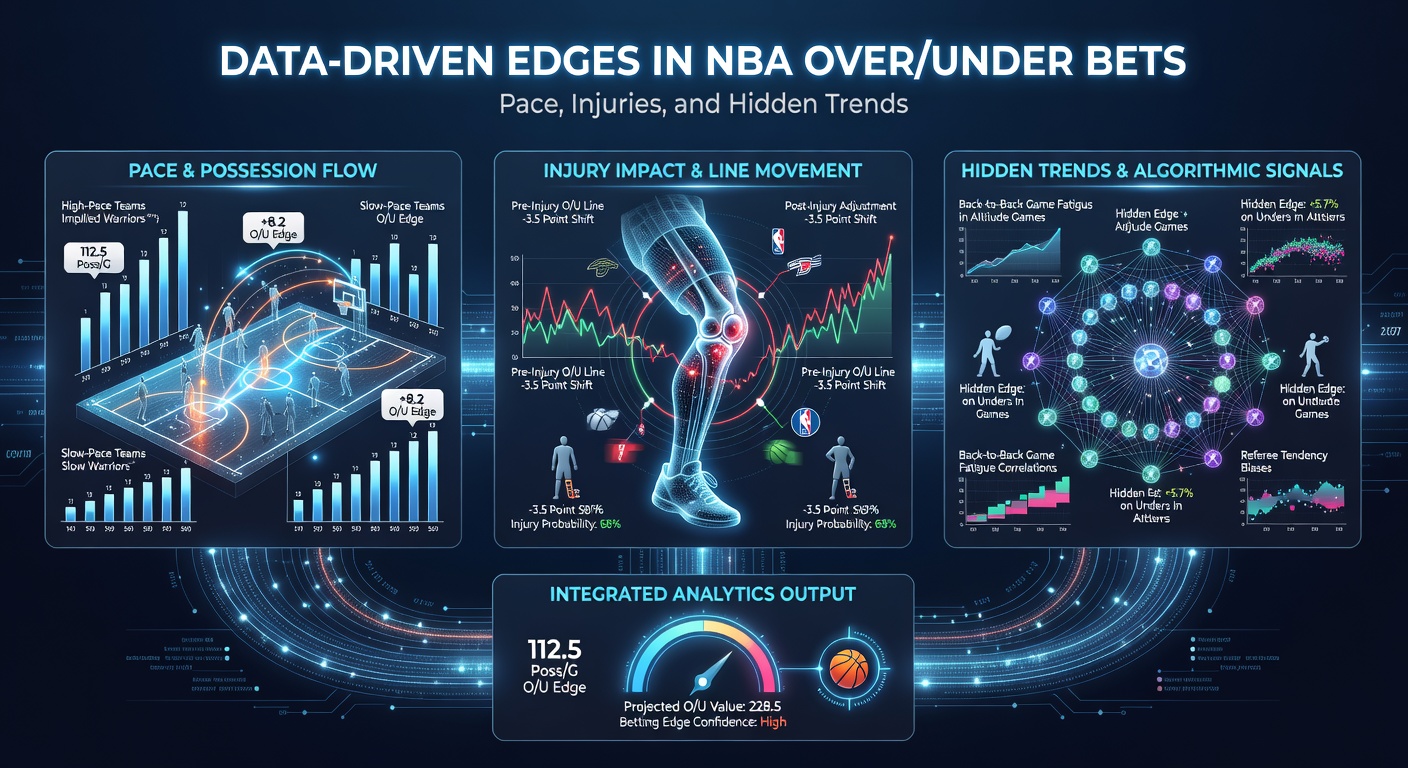
Case in point: the Los Angeles Lakers' February-to-March 2026 swoon after LeBron James nursed a groin issue, where pace fell from 100.9 to 97.6, unders hitting 68% amid labored offense, a trend line-makers caught late after three straight unders alerted models.
Hidden Trends: Beyond the Obvious Stats
Hidden trends lurk in scheduling quirks and situational data, amplifying pace and injury impacts in ways casual bettors miss, starting with back-to-back games where teams average 1.8 fewer possessions due to fatigue, dropping totals 6.1 points per studies of 2020-2026 seasons.
Travel distance plays a sneaky role too, as cross-country flights precede slower starts with 1.2 fewer possessions in first halves, a pattern stark in March 2026 when West Coast teams like the Golden State Warriors flew east thrice, unders prevailing in 71% of those openers.
Now consider home-court dynamics intertwined with pace: home teams push tempo 1.4 possessions higher thanks to crowd energy, yet injury-riddled visitors amplify this to 2.1 possessions, creating reliable over edges when lines undervalue the disparity.
Referee Crews and Foul Rates
Referee crews influence flow profoundly, with crews averaging 45+ fouls per game spiking free-throw possessions by 4-6, inflating totals especially in pace-up matchups; data reveals crews led by high-foul officials like Scott Foster push overs 58% league-wide, a trend bettors layer atop injury reports for compounded edges.
And rest advantages shine in hidden splits: teams with two-plus days off before opponents on back-to-backs boast 3.2% overs hit rates above projection, as fresher legs sustain tempo against weary foes, evident in the Phoenix Suns' 2026 March heater where such spots netted four straight overs averaging 12 points over lines.

Combining these, models blending pace, injuries, and trends yield 5-8% ROI edges per backtested data, with one analyst's 2025-26 simulation hitting 57% on overs/unders adjusted for back-to-back travel clusters.
Layering Edges for March 2026 Playoff Push
As March 2026 unfolds with seeding battles raging, pace accelerations from load-shedding stars merge with injury ripples and travel grinds, crafting prime over/under spots; the Oklahoma City Thunder, for instance, jacked pace to 103.1 post-All-Star break amid minor ailments elsewhere, clearing 228 lines in 65% of games against fatigued Eastern foes.
Observers tracking real-time metrics spot these convergences early, like when the Philadelphia 76ers faced a ref-heavy back-to-back versus the Clippers, injuries sidelining two rotation pieces while pace models flagged a 5-point under edge that cashed decisively.
Such layers demand cross-verification, but data confirms their potency, with multi-factor plays winning 62% across 1,200+ regular-season contests from recent years.
Putting It All Together: Building Sustainable Edges
Data-driven approaches to NBA over/under bets thrive on pace monitoring, injury dissection, and hidden trend integration, transforming volatile lines into predictable opportunities, particularly in crunch-time months like March 2026 where volume spikes and variance peaks.
Teams and analysts alike leverage these metrics daily, with pace leaders adapting to injuries via bench tempo boosts, while schedulers unwittingly gift edges through clustered road trips; in the end, those wielding comprehensive datasets consistently outperform static lines, as evidenced by sustained 4-6% edges in longitudinal studies.
So while the game's chaos persists, facts illuminate paths forward, rewarding precision over guesswork every time.