Back-to-Back Demands and Recovery Windows Transforming Basketball Wagering Patterns
Written by Jakob Lorenz · Aug 25, 2026
Back-to-Back Demands and Recovery Windows Transforming Basketball Wagering Patterns
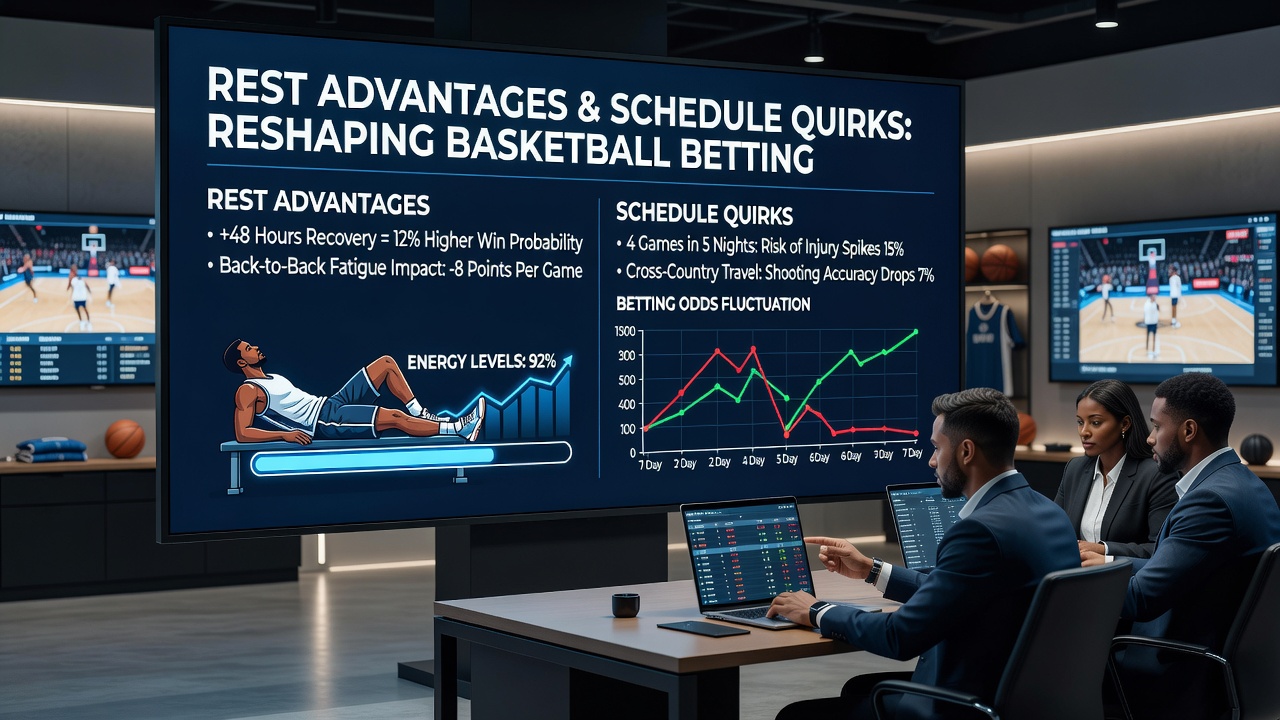
Schedule structures in professional basketball have created measurable patterns that influence wagering decisions across major leagues, with teams facing varying levels of rest between contests and travel requirements that alter performance metrics. Data compiled from league records shows that squads playing on the second night of back-to-back sets post lower scoring averages in several tracked seasons, while opponents benefit from additional preparation time. Observers note these elements combine with factors such as cross-country flights and consecutive road games to produce shifts in point spreads and total lines that bettors track through historical datasets.
Rest Advantages in League Schedules
League calendars distribute games unevenly across weeks, producing stretches where some franchises secure multiple days off between matchups whereas others navigate three games in four nights. Figures from the 2024-2025 NBA season indicate teams with at least two full rest days scored 4.2 points higher per contest on average compared to those operating on one day of recovery, according to compiled box score analysis. Similar trends appear in international competitions monitored by FIBA, where compressed qualification windows leave limited recovery opportunities for national squads. Bettors incorporate these rest differentials into models that adjust projected totals, particularly when a well-rested home side faces a traveling opponent coming off consecutive games.
Travel and Consecutive Game Effects
Geographic spread of franchises forces extended trips that compound fatigue beyond simple rest counts. Teams crossing multiple time zones exhibit reduced three-point shooting percentages in the first half of subsequent contests, a pattern documented in studies tracking player movement data from wearable devices. Australian researchers examining NBL schedules identified comparable drops in defensive efficiency following long-haul domestic flights, information that has informed betting frameworks used by operators in that market. Schedule quirks such as matinee games after late-night finishes or holiday back-to-backs further distort standard performance baselines, prompting adjustments in live betting markets where in-game momentum shifts appear more pronounced.
What's interesting is how these variables interact with injury reports released closer to tip-off, creating windows where line movements accelerate once updated rosters become public. European basketball leagues governed by Euroleague Basketball have introduced limited rest mandates during certain tournament phases, providing additional data points for comparative analysis across continents. Canadian gaming regulators have published aggregated operator reports showing increased volume on basketball props tied to player minutes when rest disparities are evident, though specific figures remain subject to ongoing collection efforts.
Betting Market Adaptations
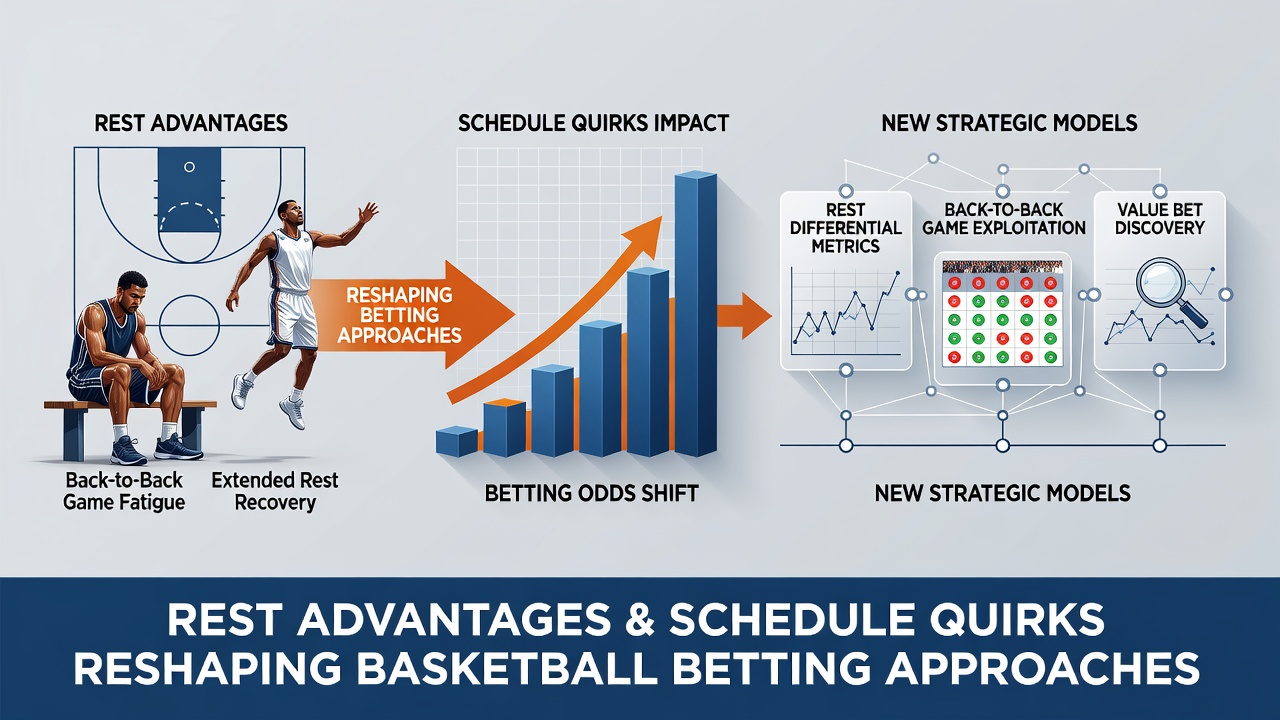
Operators have responded by refining odds compilation processes that weigh schedule density more heavily than in prior years. Historical datasets now feed algorithms that flag games where one participant holds a rest edge exceeding 48 hours, resulting in systematic line adjustments of one to three points on average. Academic papers from sports analytics programs at universities in the United States have examined these correlations using multi-season samples, revealing that underdog covers occur at elevated rates when the favorite plays its third game in four nights. Those reviewing international fixtures note parallel developments in leagues such as Spain's ACB, where midweek travel requirements produce comparable statistical deviations.
August 2026 brings the release of preliminary 2026-2027 NBA schedules, an event that allows early identification of problematic stretches including extended road trips and compressed playoff preparation periods. Market participants examine these calendars against projected roster changes, incorporating data on player age profiles since veteran groups show steeper efficiency declines under heavy schedules. Industry reports from gaming associations in multiple jurisdictions track how such information influences parlay construction and prop selections, particularly for rebounding and assist categories that fluctuate with minutes restrictions.
Statistical Indicators and Model Inputs
Performance tracking extends beyond simple win-loss records to include advanced metrics such as pace-adjusted efficiency and fourth-quarter scoring margins. Research indicates that teams with superior rest profiles maintain higher shooting accuracy in final periods, a factor reflected in live total lines that move during the third quarter. External sources including university-led performance labs have contributed datasets linking sleep quality measurements to on-court output, though integration into public betting tools remains gradual. Observers note that schedule quirks like back-to-back games on opposite coasts generate the most pronounced variances, prompting dedicated tracking categories in several commercial analytics platforms.
Regional Variations in Schedule Management
League policies differ by region, with some organizations mandating minimum rest intervals during regular seasons while others prioritize broadcast-driven date placements. Data from Asian basketball confederations shows shorter recovery windows correlating with higher foul rates in tracked tournaments, information used by regional betting services when setting totals. In contrast, certain South American domestic leagues publish advance calendars that allow longer planning horizons, reducing uncertainty for those modeling outcomes. These differences create cross-league comparative opportunities for analysts examining how rest policies affect overall scoring environments.
Conclusion
Schedule structures and recovery periods continue to supply measurable inputs that reshape basketball betting approaches across professional circuits. Comprehensive datasets now encompass travel distances, consecutive game counts, and rest differentials, enabling refined projections that account for these variables alongside traditional statistics. As calendars evolve and additional performance tracking tools emerge, market participants maintain focus on these elements when evaluating individual contests and multi-leg combinations.